by Sam Franklin | July 07, 2022 | 38 min read
Google Analytics setup for Shopify – the full step-by-step guide
Get fundedLast updated: August 19, 2022
Google Analytics is a tool for understanding your eCommerce data. If you're not using it, you're missing out on valuable insights about fundamental parts of your business, your customers, and their behaviour. In this Bloom guide, you'll learn how to set up Google Analytics eCommerce tracking for Shopify. We'll walk you through each step of the process, from creating an account to setting up funnels and goals. By following these instructions, you'll be able to start collecting data about your online store activity and measure progress in no time.
Table of contents
- How to set up Google Analytics Shopify
- What to track with Google Analytics
- Key eCommerce metrics to know on Google Analytics
- Unlock your business's potential with GA and Bloom
- Frequently Asked Questions
How to set up Google Analytics Shopify
You've heard that you need to be tracking your website's analytics, but you have no idea where to start. It can be confusing to figure out how to set up Google Analytics on Shopify, especially if you're new to online marketing. There are a lot of different eCommerce settings and options, and it's easy to make a mistake that could impact your eCommerce data tracking. Not tracking your website's analytics is like flying blind. You have no idea what's working and what's not. Therefore, you can't make informed decisions about how to improve your site's performance.
Here's what you need to do.
Step 1: Verify that you don't already have Google Analytics activated
This first step may seem silly, but it's a very common mistake. So before you go any further, take a moment to double-check that you don't already have Google Analytics eCommerce tracking enabled in your Shopify account. Once you've confirmed whether or not it's disabled, you can proceed to the next step in setting up your analytics tracking.
Go to your Shopify admin, then Online store > Preferences.
In the Google Analytics section, there'll be two possible scenarios:
An empty box that says 'Paste your code from Google here'. If this is the case, then ignore the next bullet point.
A code beginning with 'UA-'. If you see this code, you already have Google Analytics enabled and can skip to Step 4: Create the necessary reporting views.
Click Themes > Actions, and then Edit code.
In the Layout section, click on the '{/} theme.liquid' file.
If you don't see either a tracking code in the Google Analytics section of your Preferences page or any tags in your 'theme.liquid' file, then Google Analytics isn't enabled.
Step 2: Create a Google account for your business
Before you can set up Google Analytics eCommerce tracking for your Shopify store, you must have a Google or Gmail account. This account will access the Google Analytics interface and allow you to track your store's traffic and performance. Simply go to the Google Account creation page and fill out the required information to create a Google account. Once you have your account, you need to open a Google Analytics account and proceed to the next step.
Step 3: Enable Google Analytics
Now it's time to enable Google Analytics – the Universal Analytics property version. This process is quite simple. Here are the steps you need to follow within Google Analytics (GA) and Shopify.
Within your Google Analytics
In your web browser, sign in/log in to Google Analytics.
Click Admin, and then Create Property in the Property column.
Enter a property name, time zone, and currency.
Select Advanced Options and create a Universal Analytics property.
In the Business Information section, choose the appropriate settings.
Accept Google Analytics Terms of Service.
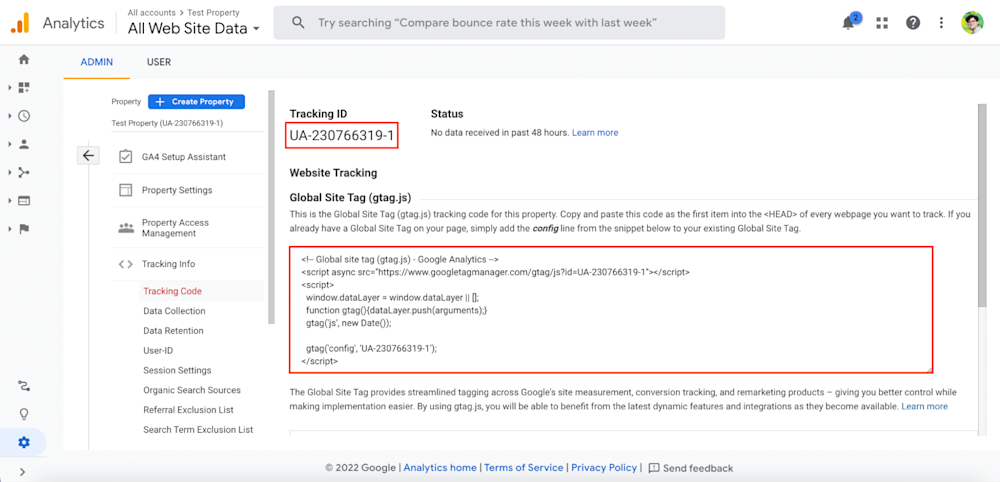
Copy the Global Site Tag (gtag.js) tracking code.
Within your Shopify store

Open your Shopify admin in a new browser tab.
Go to Online store > Preferences page.
Next to Google Analytics, paste the Google Analytics code into the empty field.
Click Save and you're done. You have enabled Google Analytics on Shopify.
Don't forget to remove your store password so GA can track your eCommerce data.
Instructions completed? Continue to the next step.
Step 4: Create the necessary reporting views
The next step is to create new views. A view is effectively a 'copy' of your data that you can customise and analyse as you see fit. You can have up to 25 views for a single property.
Create at least three views for your store:
All website data view / raw view. This allows you to see the eCommerce data exactly as it is stored on the website. The raw view is great for troubleshooting errors or getting a closer look at how the data is organised.
Master view / non-raw view. The master or non-raw view is where you can really dig into the nitty-gritty and get the insights you need to make informed decisions about your Shopify store. With this view, you can apply all kinds of filters that modify the eCommerce data you collect to make it as accurate as possible.
Test view. Ideal view for personal testing ground. Here, you can try out any filters without impacting Google Analytics reports. This is the place to experiment with different combinations of filters and see how they affect your data.
Having these views gives you a complete picture of your eCommerce data.
Creating new views is easy and takes seconds - just follow the steps:
Go to Admin in Google Analytics.
Click Create View in the View column.
Enter the reporting view name and time zone.
Once you've created these three essential views, you can move on to the next step.
Step 5: Use the same currency and time zone as Shopify
If you want your Google Analytics data to match up with your Shopify data, it's considered best practice to use the same currency and time zone on both platforms. If they're not, you'll end up with messy eCommerce data, maybe thinking that your sales data were lower on Google Analytics than they actually were on Shopify.
To do this step, access Google Analytics View settings and when creating a new view, select the same currency and time zone as your Shopify store. This will ensure that all of your data is consistent, accurate and easy to compare.
In the reporting view you create, check the reporting time zone.
Then open your Shopify Settings, and go to Store details.
Verify the Store currency and Standards and format boxes.
Save the changes and go to the next step.
Step 6: Turn on eCommerce tracking
In this step, you will collect data about your customers' transactions and revenue, as well as their behaviour on your eCommerce site. There are two different levels of eCommerce tracking that you can use: basic and enhanced.
Basic eCommerce tracking gives you transaction and revenue data, while Enhanced eCommerce tracking provides additional information about visitor behaviour. For example, how customers interact with your store, what they add to their shopping carts, how they complete checkout, and more. With these insights, you can make changes to your store that will improve the user experience and potentially increase sales. Implementing eCommerce tracking is simple, and it's worth the effort to get the most out of Google Analytics.
To set up either type of eCommerce tracking, follow these steps.
Turn on basic Google Analytics eCommerce tracking
Not tracking your transaction data is like not knowing what's happening or how your business is performing. Here's how to activate basic eCommerce tracking:
Log in to your Google Analytics account and select the Admin tab.
Under the View column, click on eCommerce Settings.
Turn on the Enable eCommerce button.
Click Save, and continue with the enhanced eCommerce tracking.
Turn on enhanced Google Analytics eCommerce tracking
With enhanced eCommerce tracking in Google Analytics, you'll be able to gather more data points and get a better understanding of your customer's journey. Here's how to enable it:
Go to your Shopify admin > Online Store > Preferences.
In the GA section, check the Use Enhanced Ecommerce box and Save.
Then, open Google Analytics and click Admin.
Go to Ecommerce Settings in the View column.
Turn on the Enhanced Ecommerce Tracking toggle.
Already saved this enhanced configuration? Now you'll see things like shopping and checkout behaviour, product data, and more within Google Analytics 24 hours after a sale or two. That's about how long it takes Shopify to connect the Google Analytics tracking tag to your site.
Step 7: Exclude referrer domains from Google Analytics
As an online shop owner, you want to make sure that you're tracking the right eCommerce data in Google Analytics. But the thing is that GA will track all traffic sources, including referrer domains. And there are certain referrer domains you may not want to track, such as your own blog or payment gateways. Some common referrer domains to put on your list:
The primary domain of your online store (e.g. yourstore.com).
The different domains Shopify has:
yourstore.myshopify.com
checkout.shopify.com
pay.shopify.com
shop.app
Any third-party payment gateways:
paypal.com
stripe.com
pay.amazon.co.uk
And so on
You can easily exclude these domains from GA by going to the Admin panel and adding them to the Referral Exclusion List. This will ensure that the eCommerce data in Google Analytics reports are clean and that you're only tracking the traffic you care about.
These are the steps you need to follow:
Go to the Admin section of your Google Analytics account.
Under the Property column, click Tracking Info > Referral Exclusion List.
Add the domain you want to exclude, and then click Save.
Now that you know how to exclude referrer domains, we can move forward to the next step.
Step 8: Create content groups
By default, all of your Shopify store's pages will be grouped together in Google Analytics under the 'All Pages' report. But what if you want to get more granular with your data to optimise for conversion? That's where content groups come in.
You can use content groups to segment your traffic by page type, product category, or anything else that matters to your business. For example, you could create a content group for all of your product landing pages and another for your blog posts. Then, you could use Google Analytics to compare the visitors and average time on site for each group.
Here's how to set up content groups on Google Analytics:
From your Google Analytics account, go to Admin.
Next, click on Content Grouping from the View section.
On this new page, click on New content grouping.
Give your content group an appropriate name.
Assign a grouping configuration, then Save.
Things to start grouping right now while you're reading this:
Blog posts
Collections
Product pages
Checkout pages
Marketing pages
Account pages
404 Errors
Support pages
Types of grouping configurations
When it comes to choosing a grouping configuration, there are three main options:
Changing the tracking code on the pages you want to group.
Using regex capture groups to extract pages.
Or creating rules to include web pages in a group.
So which one should you go for? Well, that depends on your specific needs and preferences. If you want more control over which pages are grouped together, then modifying the tracking code on each individual page may be a good alternative. However, if you're looking for a quick and easy way to group pages together, then using regex capture groups to extract pages or creating rules to include web pages in a group may be more up your alley.
Ultimately, it's up to you to decide which grouping configuration is right for you. In most cases, we recommend going for the Group Using Extraction option with the following regular expression rules that are quite well suited to Shopify:
Collections:^/collections/(.*?)$
Products:^.*/products/(.*?)$
Pages:^/pages/(.*?)$
Blogs:^/blogs/(.*?)$
Next parade, Step 9: Track internal search.
After you've finished configuring your content groups, look at how they perform with primary dimensions and segmentation in standard or custom reports. You can also hire a Shopify expert to set up Google Analytics eCommerce tracking for you.
Step 9: Track internal search
You're losing business if you're not tracking what people are searching for on your eCommerce site. This lack of information may cost you traffic and sales. And what's true is that site searchers are 2-3 times more likely to convert. Now it's time to see what's going on with your internal search data. This will let you know how customers use your site's search feature and make changes accordingly to elevate your stores' marketing campaigns and sales efforts.
Let's say you notice that suddenly a reasonable amount of customers are searching for 'blue water shoes' but not finding what they're looking for. You can adjust your tagging and inventory to ensure those items are more easily found. To set up tracking for internal search:
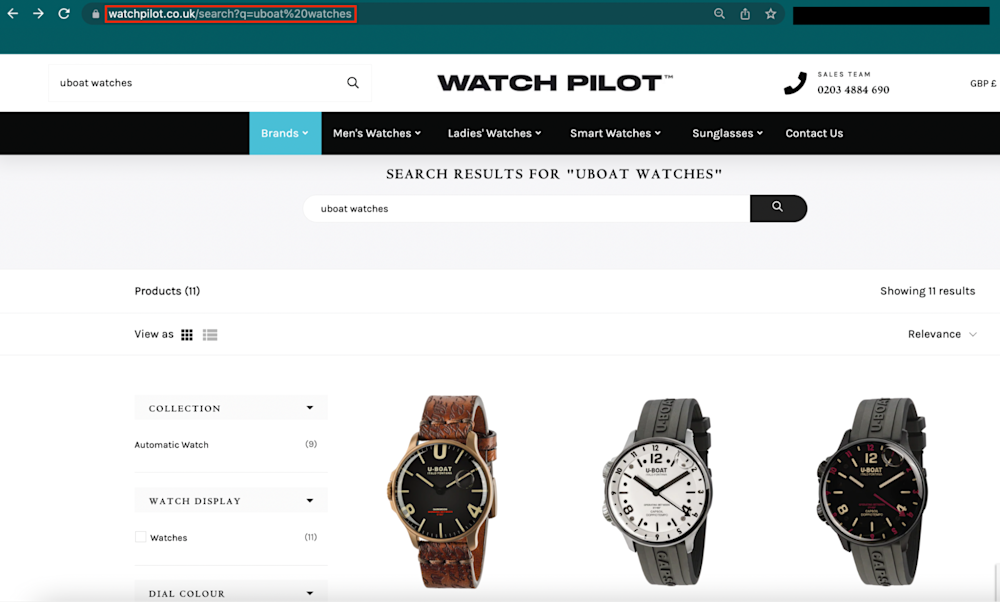
Type whatever item into the search box on your live Shopify store.
Look at the URL where your search term appears. It may be one of these:
https://yourstore.com/search?q=search+term
https://yourstore.com/search?&b=search+term=yes
https://yourstore.com/search?type=product&q=test
Go to your Google Analytics account > Admin > View Settings.
Turn on the Site search Tracking button.
Specify the query parameter that is used for searches on your eCommerce site.
Click to tick the Strip query parameters out of the URL checkbox.
Save your changes, and that's it.
Once you've done this, you'll start seeing internal search data in your Google Analytics within approximately 24 hours. After that, you can visualise the data inside your Shopify Analytics dashboard or in GA under Behavior > Site Search.
Step 10: Remove unwanted query parameters
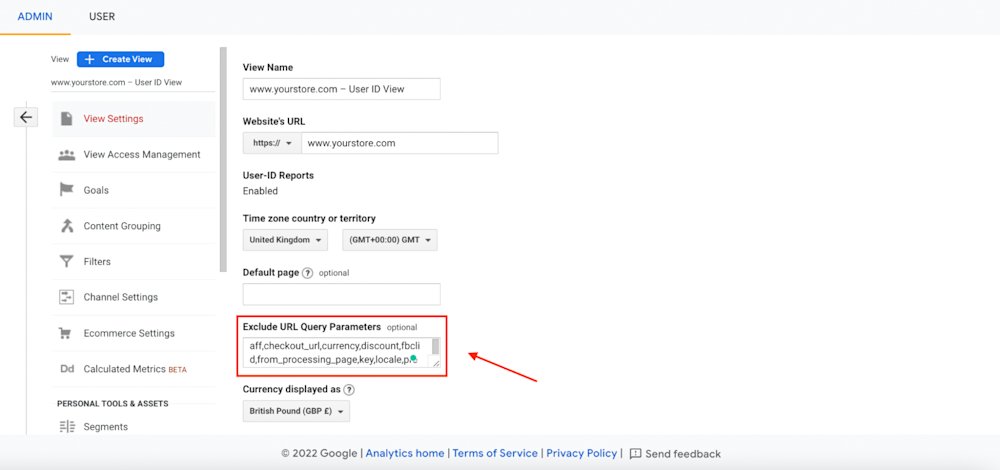
Our tenth step in setting up Google Analytics eCommerce tracking on Shopify ensures that you're not tracking any unnecessary information, query parameters specifically. You probably excluded the 'q' query parameter in your store URLs in the previous step.
Now you need to remove the 'search' query parameter. Why? Because result pages like /search?q=blue+water+shoes or /search?q=uboat%20watches would end up being reported for every single unique search. That can screw up your data, and we don't want that.
Instead, do this to avoid those extra query parameters:
Log in to your Google Analytics account.
Click on Behavior Report > Site Content > All Pages.
Then, type '?' in the mini search bar to filter the data.
Browse the pages to see which extra parameters make sense to exclude.
Go to Admin and select View Settings under the View column.
Add your new parameters to the Exclude URL Query Parameters section.
Here's a template list developed by Joshua Uebergang, Director of Digital Darts:
aff, checkout_url, currency, discount, fbclid, from_processing_page, key, locale,preview_key, refresh_count, ref, return_url, skip_shopify_pay, sort_by, step, token, variant, _ke, _pos, _sid
You can sit back and relax knowing that your data is safe from errant query parameters.
Step 11: Activate Google Signals
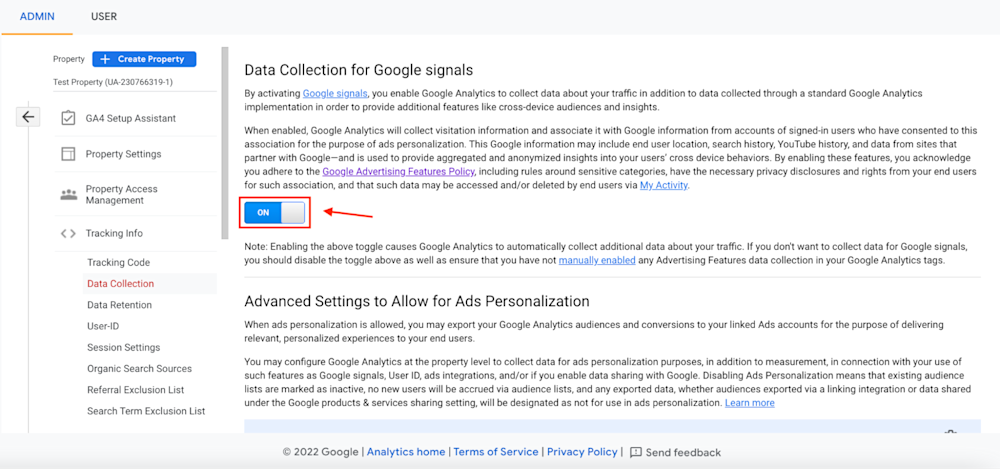
Google Signals is a must-have feature for advertising and remarketing purposes. It allows you to collect demographic and cross-device data as well as additional information about users. All of this is possible by linking visitor information with users signed into their Google accounts who've consented to Ad personalisation.
To enable Google Signals, follow these instructions:
Open your Google Analytics Admin page.
In the Property column, click Tracking Info > Data Collection.
Then, follow the prompts to activate the Google Signals feature.
You must agree to the Google Advertising Features Policy.
Step 12: Set up goals and funnels
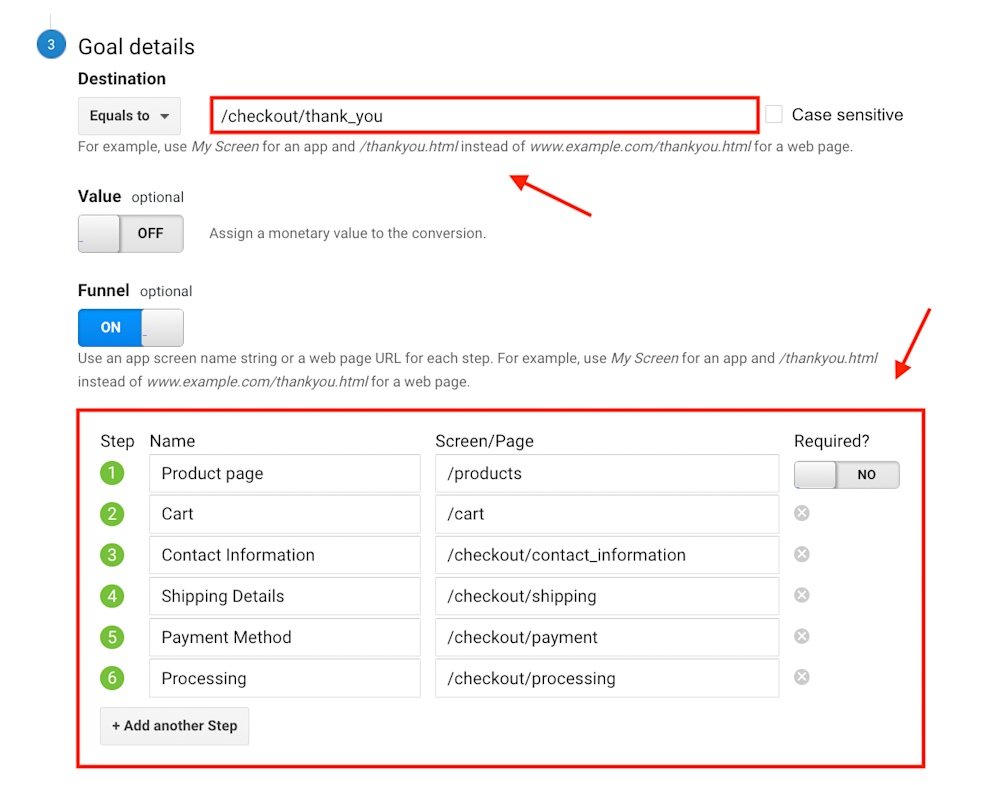
Funnels help track customers' path as they move through your online store, while goals let you measure how well your eCommerce site is achieving specific objectives.
You can fine-tune your store to boost the overall experience and increase conversions when you track these key eCommerce data points. There are four types of goals:
Destination. A specific location on your site that is loaded.
E.g. Thank you pages on a website or app.
Duration. Sessions that last a certain amount of time or longer.
E.g. 5 minutes or longer spent on a blog section.
Pages/Screens per session. Someone views X number of screens or pages.
E.g. 7 pages or screens have been loaded.
Event. It's an action defined as an 'Event' that is triggered.
E.g. Ad click, social recommendation, video play, etc.
You'll need to decide what action you want your customers to take on your eCommerce site and then set up a goal, such as making a purchase or signing up for your newsletter. Once you've decided on your goal, you can set up your funnel, which is basically the path customers take to reach your goal. Visit Analytics support to learn more.
Without further ado, let's see how to set up both goals and funnels:
From your Google Analytics panel, go to the Admin tab.
Next, in the View column, select Goals.
Click on + New Goal > Custom > Continue.
Enter this goal name: 'Checkout Complete'.
Pick Destination as your goal type.
Leave 'Equals to', and specify this URL: '/checkout/thank_you'.
Add all the steps listed in the table below, and save the changes.
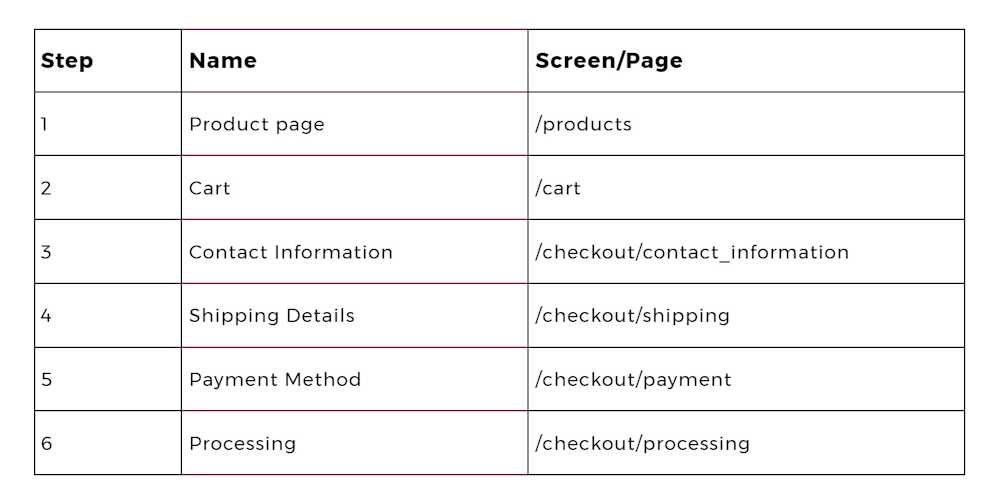
Keep in mind that the URLs you use for your funnel will vary depending on what product(s) and type of checkout system your store has. You can see the funnel in action in Conversions > Goals > Funnel Visualization, as long as you wait around 24 hours as usual.
We love this report because it shows how users enter and exit pages. You can identify where people are getting confused or whether you need better messaging so more potential customers don't give up before reaching the end of your funnel.
The above is an example of a brand-new Shopify website with no actual sales data. This is how your report will look like at the very beginning – unless you have a shop up and running. As you get sales, you will gradually notice some numbers here.
Extra funnel – Checkout Behavior report
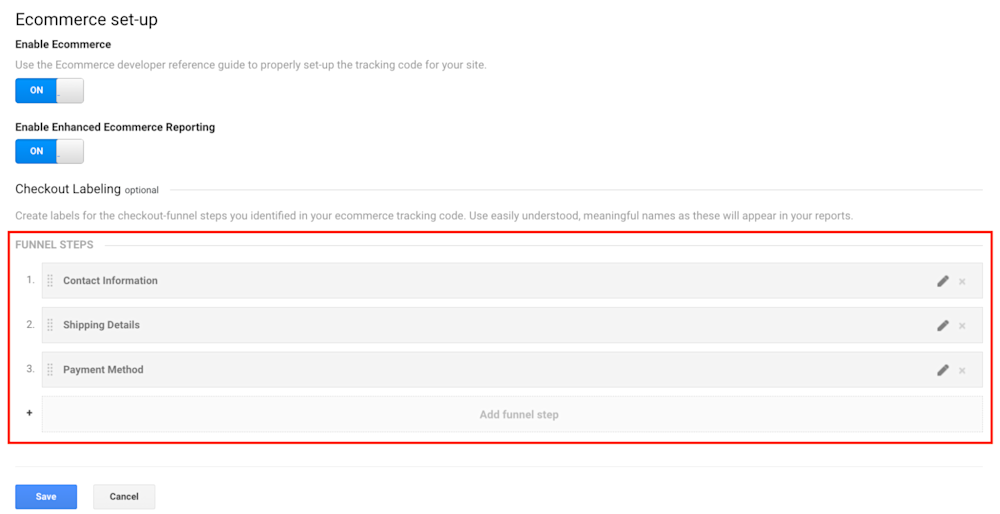
One of the most insightful features of Google Analytics eCommerce tracking is the Checkout Behavior report. This report gives a detailed overview of how your customers are interacting with your whole checkout process, which is super helpful for conversion rate optimisation.
You can use it to identify which areas of the checkout process are causing people to abandon their carts and then take steps to fix those issues. For example, in case you see an alarming percentage of people abandoning their carts at the shipping stage, you might want to offer free shipping or a faster shipping option. Alternatively, if you see people abandoning their carts at the payment stage, you might want to offer more payment options.
Here's how to configure this magic report:
Access Google Analytics dashboard, and then Admin.
In the View column, click on Ecommerce Settings.
Now, add the following three funnel steps, and save the changes.
Contact Information
Shipping Details
Payment Method
Open your Shopify admin in a new tab > Online Store > Preferences.
In the Additional Google Analytics JavaScript box, paste this code:
// Checkout steps for the Checkout Behavior report in Google Analytics from digitaldarts.com.au/analytics
var ShopifyCheckoutstep = Shopify.Checkout.step;
switch (ShopifyCheckoutstep) {
case "contact_information":
ga("require", "ec");
ga("ec:setAction", "checkout", {
"step": 1,
"option": "contact_information"
});
ga('send', 'event', 'checkout', 'contact information', { nonInteraction: true });
break;
case "shipping_method":
ga("require", "ec");
ga("ec:setAction", "checkout", {
"step": 2,
"option": "shipping_details"
});
ga('send', 'event', 'checkout', 'shipping details', { nonInteraction: true });
break;
case "payment_method":
ga("require", "ec");
ga("ec:setAction", "checkout", {
"step": 3,
"option": "payment_method"
});
ga('send', 'event', 'checkout', 'payment', { nonInteraction: true });
};
Script by Shopify Expert, Joshua Uebergang.
Once you set all this up, save the changes and wait about a day. The eCommerce data collection will look something like this, but with the funnel steps we set up above.
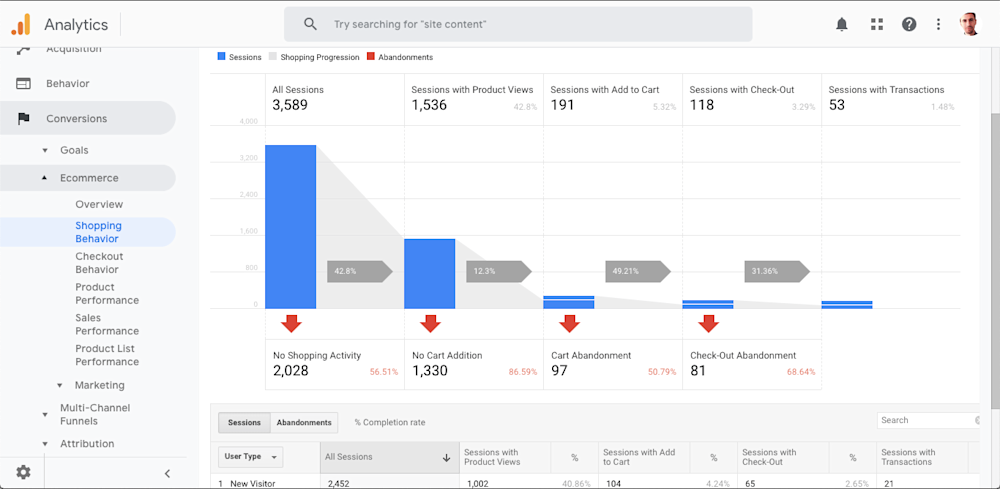
With the help of JavaScript, you can enhance your eCommerce tracking experience and gain more insight into what's happening with customers. Check out Simo Ahava's blog post to learn how to do this for yourself or on an existing site. Let's move on to the next step.
Step 13: Implement enhanced link attribution

With enhanced link attribution, you can see how many times each link was clicked and what percentage of people clicked on it. And then, use this information as a starting point to understand which sections, buttons, pages, or any type of interaction your visitors play with the most. The value behind this is that you can make all the necessary adjustments within your store to make the shopping process easier for visitors and generate even more sales.
Follow these bullet points to implement the enhanced link attribution feature:
Go to your Shopify admin, click on Online Store, and then Preferences.
Copy the following line of code:
ga('require', 'linkid'); // Enhanced link attribution
Paste it into the Additional Google Analytics JavaScript section, and save.
Now, log in to your Google Analytics Account > Admin.
Under the Property column, select Property Settings.
Turn on the Use enhanced link attribution button and click on save.
Download the Page Analytics (by Google) Chrome extension.
Browse your store like a regular visitor and start seeing the data.
Step 14: Fix all possible spam hits
Spam traffic skews data, making it difficult to get accurate insights and wasting time and resources. There are a couple of telltale signs to detect spam traffic, including checking the traffic source and looking for patterns in the eCommerce data.
Once spam traffic has been identified, you can take actions to reduce its impact, such as filters, blocking IP addresses, and excluding known spammy domains.
Always keep an eye on your Bounce Rate and Avg. Session Duration eCommerce metrics on Acquisition > All Traffic > Referrals, as these are often indicative of spam traffic.
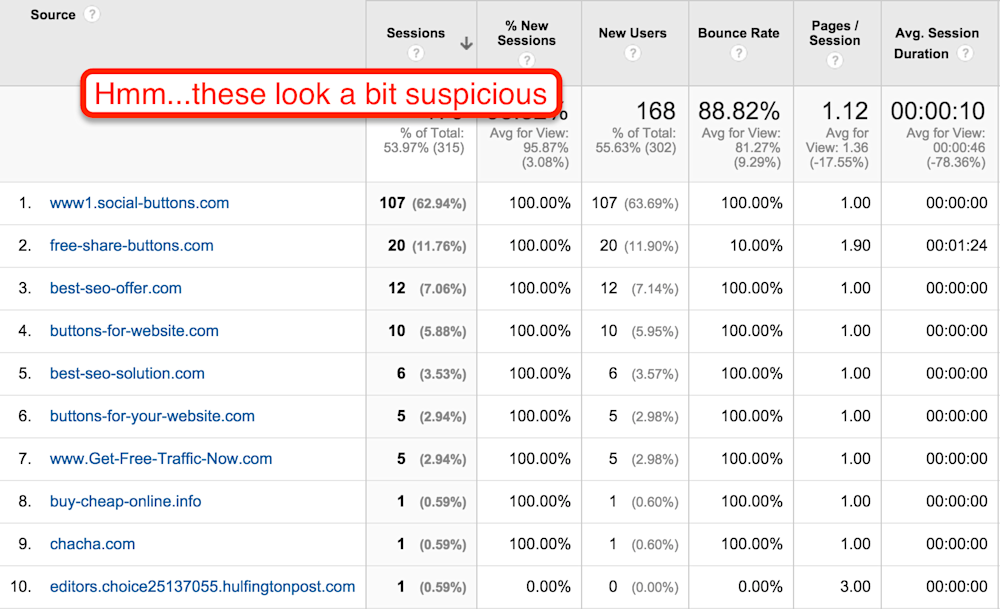
No matter what business you're in or how well you set up your Google Analytics eCommerce tracking, spam hits are a reality. Fortunately, there's a way to fix them.
Enable bot filtering
Go to the Admin tab in GA and click View Settings.
Scroll down to the Bot Filtering section.
Tick the 'Exclude all hits from known bots and spiders' box.
Save your new changes.
Create new filters
Return to the Admin panel in Google Analytics > View column > Filters.
Add a new filter here, and give it a name (something like 'Spam Blacklist').
Select the Custom filter type, and then Exclude.
In the Filter Field drop-down menu, go for Campaign Source.
Enter the spam domains you want to block in the Filter Pattern box.
It should be something like this with the \.| pattern:
spammylord\.|fakeclicks\.|uglyhits\.
You can eliminate most of the spam hits you're receiving in Google Analytics by activating the bot filtering function and creating new filters. And, if you're still seeing some spam hits after taking these measures, reach out to the Analytics Help Center. Continue with the next step.
Step 15: Track logged-in users
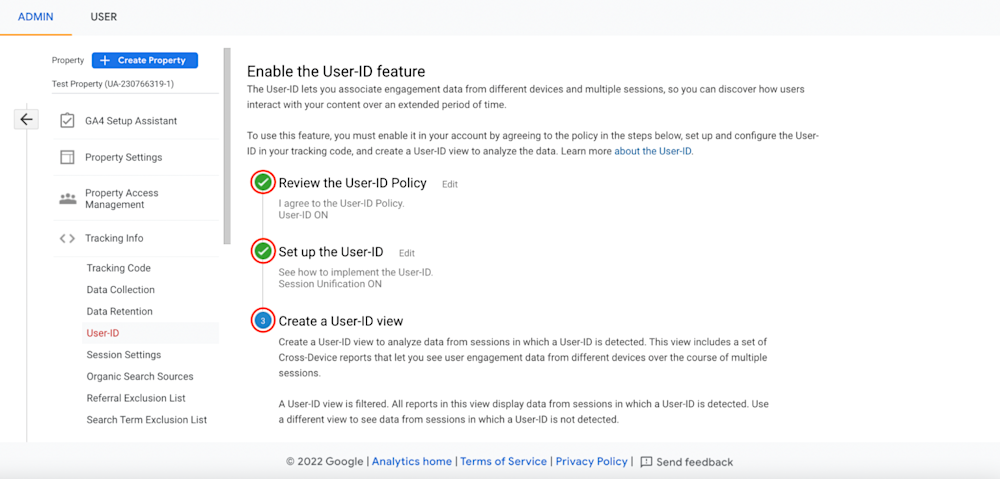
This step combines User ID with Client ID as a magic formula to associate multiple sessions (and any engagement data within those sessions) with a single user.
When you have a User ID, you're capable of:
Understanding customer lifetime value better.
Seeing how channels work together to assist conversions.
Remarketing to high-value shoppers.
Consider a scenario where someone abandons checkout on their phone and completes their purchase on a desktop. We want to acknowledge the mobile session for its assistance. The User ID in GA unifies sessions for a logged-in user, allowing you to get a sense of customer behaviour across devices. As a result, setting up the User ID + Client ID recipe is a key step in optimising your Google Analytics eCommerce tracking.
Want to configure everything? Check out the instructions below:
From your Google Analytics account, go to the Admin page.
Next, click on the Tracking Info subtab and then User-ID.
Read and agree to the User ID Policy.
Leave the Session Unification button activated.
Create your new User ID View, and follow the prompts in that section.
Turn on the Show User-ID Reports.
Use the same eCommerce settings from your Master View / Non-Raw View (see Step 4).
Now, open Shopify admin, and click Online Store > Preferences.
Add this line of code in the Additional Google Analytics JavaScript box:
if(__st["cid"]) ga('set', '&uid', __st["cid"]); // User ID tracking
At this point, this is how your Google Analytics section should look right now.
By the way, you don't need to Enable Users Metric In Reporting because Google Analytics already sets it as such by default. But, if you want to be 100% sure that it's activated, go to GA Admin, select Property Settings, and check the Enable Users Metric In Reporting box.
Step 16: Explore organic search keywords
You've set up your Shopify store and added Google Analytics eCommerce tracking code to your site. Now let's start understanding how people are finding your site.
Did they get there through a link from another site?
Did they come directly by typing your URL into their browser?
Or did they find you through a search engine like Google?
When you want to know how your store appears on Google and which search terms are getting you clicks, there's only one surefire way to find out - by using Google Search Console. Syncing your Shopify store with Google Search Console and then with Google Analytics is easy and only takes a couple of minutes. Search Console is a free service offered by Google that helps you monitor, maintain, and troubleshoot your site's presence in Google’s search results.
You don't need to sign up for Search Console to be included in Google's search results, but doing so can help you understand how Google sees your site and track your site's performance in search results. Best of all, you can analyse your progress over time to see how your SEO efforts are paying off. Setting up Google Search Console is a must.
Here's how to link Google Search Console with Shopify and Analytics:
Sign in/log in to Google Search Console.
Verify your site with this Shopify Help Center video:

Open your Google Analytics dashboard.
Go to Acquisition > Search Console > Queries.
Click on the Set up Search Console data sharing button.
You'll be automatically redirected to Property Settings.
Scroll down to the Search Console section, and select Adjust Search Console.
Follow the instructions to complete the configuration and save the changes.
That's it! You've now successfully connected your Shopify store with Google Search Console and Google Analytics to start tracking organic search keywords.
Step 17: Get custom alerts
One of the key features of Google Analytics is custom alerts. It allows you to receive notifications whenever there's a significant change in your eCommerce data and analytics. Alerts can be sent to you via email or SMS, and you can choose to receive them as soon as something happens or at a set time each day, week, or month.
For example, you could create an alert that triggers when your conversion rate decreases by 10%. These custom alerts are a great way to stay on top of your data and make sure that you're taking action to tackle your online store challenges.
To set up the custom alerts feature:
Go to your Google Analytics account > Admin tab.
Under the View column at the right, select Custom Alerts.
From here, you can create an unlimited number of alerts.
Specify the parameters that you want to be notified about.
Remember to include your email address and save the alert.
While there's a wide variety of custom alerts for eCommerce you can create, we recommend setting up at least the two most important ones right away:
Alert #1: Sudden drop in traffic
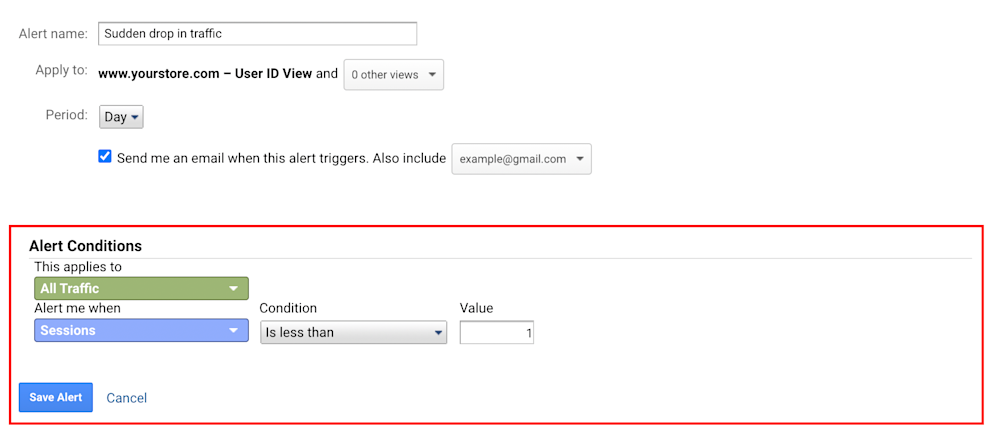
If no one is visiting your store, that's a big problem that needs to be addressed ASAP. That's why setting up a Sudden Drop in Traffic alert is the bare minimum. With this type of alert, you'll be immediately notified if there's zero traffic so that you can take action. Maybe there was a change to your website that broke your Google Analytics data collection. Or maybe your site is down. Either way, this is a critical alert that all website owners need to configure.
For this alert, enter the following conditions:
Name: Sudden drop in traffic.
Period: Day.
This applies to: All Traffic.
Alert me when: Sessions.
Condition: Is less than.
Value: 1.
Alert #2: Revenue spike
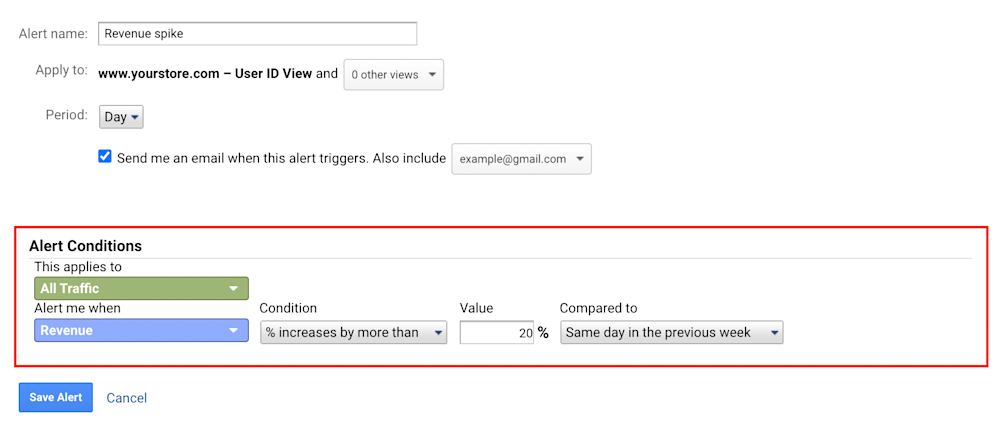
The second must-have custom alert is the Revenue Spike. It lets you know when you've had a nice boost in revenue from new visitors compared to the previous week.
This way, you can quickly spot what's working well and do more of it. Perhaps it's a popular product, marketing campaign, or an article on a media outlet. Whatever the case is, take advantage of the situation and other opportunities as they arise.
For this alert, enter the following conditions:
Name: Revenue spike.
Period: Day.
This applies to: All Traffic.
Alert me when: Revenue.
Condition: % increases by more than.
Value: 20%.
Compared to: Same day in the previous week.
Step 18: Follow ongoing best practices
You've set up Google Analytics on your Shopify store - congratulations! Now that you're collecting real juicy eCommerce data, it's important to stay up-to-date on best practices to continue to get the most out of your analytics.
Collect campaigns data with UTM parameters
One best practice is to track campaigns with UTM parameters. UTM parameters are variables you can add to a URL to track specific campaign details. For example, you can use UTMs to track which campaigns are driving traffic to your store or which ones are resulting in sales. This will help you see which of your marketing campaigns drive the most traffic and sales.
You can learn more about how to configure UTM parameters on this Analytics Help resource: Collect campaign data with custom URLs.
Make annotations on significant changes
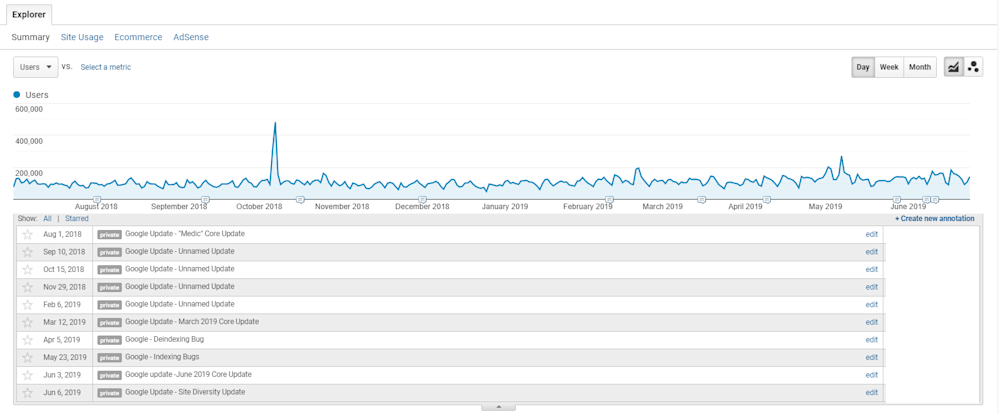
One of the ongoing best practices you should follow when using Google Analytics is inserting annotations below line graphs. An annotation is a feature to leave a comment about any significant change that you see in your eCommerce data. By annotating changes to your analytics, you'll be able to easily picture what is causing unusual data changes when you analyse and report on the data in the future. Plus, annotations can be a helpful way to communicate with other members of your team about changes in the GA numbers.
Exclude internal traffic from team members
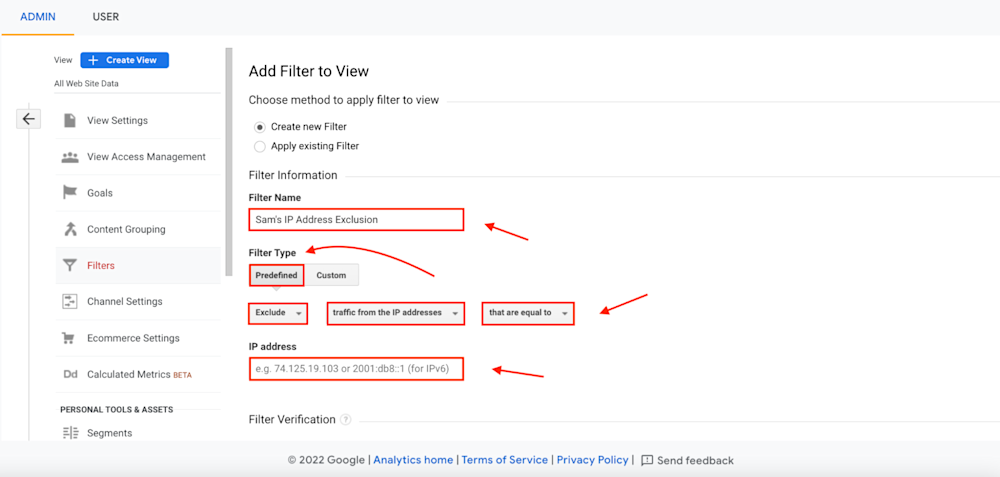
Remember that everything related to Analytics is an ongoing process: there are always new best practices to follow and old ones to revisit. Another good practice for Shopify store owners is excluding internal traffic from team members. You do this to ensure that the data you're bringing in comes from actual customers and not clicks from employees, agencies, partners, or any kind of collaborator. Here's how to exclude this traffic:
Open Google Analytics, and go to the Admin dashboard.
In the View column, select Filters.
Click on the + Add Filter button.
Leave the Predefined option, then select these:
Filter type: Exclude
Source or destination: traffic from the IP addresses.
Expression: select the most appropriate.
Enter the IP address or a regular expression.
It may seem like a small detail, but following practices like this will help you get the data as accurate as possible - and that's essential for decision-making tasks.
Step 19: Report, analyse, and review
Now that you've completed the set-up for Google Analytics on Shopify, you have to start reporting, analysing, and reviewing your data. This involves using primary dimensions, secondary dimensions, and segments to extract the key data points you need for growth.
You can also create custom eCommerce reports to track specific metrics that are important to your eCommerce store. To ensure all this configuration is working properly, open an Incognito window and see if there's an active user from your location in Google Analytics: Home > Realtime Report > Overview. If so, you're finally done.
What to track with Google Analytics
It can be a little confusing to figure out what to track and how to use the data at the beginning. That's why we gathered these four things you can track with Analytics:
Your best customers
Discovering who your best customers are is vital to any business's success. If you don't know who they are, you won't be able to market to them effectively. After all, they're the ones who are most likely to buy from you again and again.
With Google Analytics, you can see which customers are most engaged with your website, what kind of devices they use, and where they're located. You can also track their sales journey from start to finish to find any potential pain points, anticipate future needs, and optimise the customer experience.
Overall, Google Analytics eCommerce tracking is essential for any online business like yours that wants to track its best customers and improve its marketing strategy. Use it wisely, and you'll almost always be one step ahead of the competition.
Demographics, interests, and geographic data
A valuable aspect of Google Analytics is its ability to track demographics, interests, and geographic data. This information can assess which areas of the website are most popular among users and tailor content and marketing campaigns to specific target audiences.
Just go to Google Analytics, then Audience Report, and Overview.
Let's say you see that most of your visitors are coming from Liverpool, you could target some of your marketing campaigns to that area. Or, if you see that a certain type of customer is more likely to purchase a particular product, you could build strategies to focus on attracting and retaining more of those customers.
How people interact with your Shopify site
Right in the Behavior report, you can get a general overview of behavioural information. This includes the average time spent on the site, the number of pages visited, and the bounce rate. This data can be highly beneficial in helping you to learn more about your customers and enhance their experience on your site.
Business goals progress
It's crucial to track your progress towards specific, measurable, and realistic goals and make data-driven decisions from them. By keeping an eye on your Shopify store traffic, conversion rates, and other eCommerce metrics, you can get a clear picture of how things are performing. After all, if you don't know how you're doing, it's not that easy to see what's working.
The right marketing goals are necessary to scale your online business faster.
Check out these 6 Must-Have Goals for eCommerce Stores by Entrepreneur.
Key eCommerce metrics to know on Google Analytics
While Google Analytics can certainly be daunting to navigate at first, with a little practice, it's easy to understand the most important metrics. You likely have a general idea of the main metrics you should be paying attention to on Google Analytics (e.g., number of visits, conversion rate, average order value), but are you digging deep enough? Let's go over the 16 metrics you should be tracking on GA to grasp how your store is performing.
Basic Google Analytics metrics
Remember that this is just a starting point - there are many other eCommerce metrics you can track depending on your online store needs.
Sessions
A session is defined as a single visit to your website. This metric tells you how often your website was accessed and how long each session lasted. This metric can be used to track overall traffic levels and identify trends over time.
% new sessions
This metric tells you what percentage of your traffic is composed of first-time visitors. So it gives you a good idea of how well you're doing at acquiring new users.
New users
This measures the number of unique visitors to your site who've never been there before. It gives you an idea of how your marketing campaigns reach new people. If you're not seeing a lot of new users, it could mean that your marketing isn't reaching the right audience.
Bounce rate
A high bounce rate indicates that people are coming to your site and quickly leaving, which means they're not finding what they're looking for. This may be a sign that your content isn't relevant enough to your audience or that perhaps your site is hard to navigate.
Pages/session
The Pages/Session metric also measures how engaged users are with your website. It represents the average number of pages viewed during a session and can be an important indicator of both the quality and quantity of traffic to your site. A high Pages/Session metric may reflect that users find your content valuable and spend more time on several pages.
Avg. session duration
This metric, Average Session Duration, tells you just that. The result is the average time spent on your site during a session (visit).
eCommerce conversion rate
In short, your eCommerce conversion rate is the percentage of transactions on your site relative to the total number of sessions. So, if you have 100 transactions and 1000 sessions, your conversion rate would be 10%. There's no magic number that all businesses should aim for. The key is to track your conversion rate over time and look for any trends or changes.
Transactions
Transactions represent the total number of unique orders on your online store. This metric provides a clear picture of your overall sales data. Additionally, transaction data can be used to track eCommerce conversion rates and assess the effectiveness of your marketing tactics.
Revenue
Revenue is perhaps the most important metric in and out of Google Analytics. It's the bottom line for any business at the end of the day. GA gives you a wealth of data on revenue, including total revenue, product revenue, and eCommerce conversion rates.
Enhanced eCommerce Google Analytics metrics
You can spend hours poring over data, studying every minuscule change. But what does it all mean? Here are the enhanced Google Analytics eCommerce metrics you need to know.
Product revenue
Looking at the overall revenue numbers is already great and insightful, but the granular details are better. That's why it's important to track product revenue as well. Product revenue is the metric from individual product sales, which gives you a better sense of which products are selling well and which ones aren't to make decisions about pricing, inventory, and marketing.
Unique purchases
The Unique Purchases metric shows how many products you've sold and how many times a product has been purchased as part of a transaction.
Let's say you sold 50 units of blue water shoes, but it only has 35 unique purchases. This means that those 50 units of blue water shoes were bought within 35 separate transactions, which is 70% of the total items. What about the remaining 30%? Who are those customers? What other products are they buying in your shop? Is there a pattern there?
That's the kind of question you can ask yourself to analyse it.
When you point out which products are being purchased in combination, you can optimise your marketing and sales strategies to boost your revenue.
Quantity
It's pretty self-explanatory. This metric measures the total number of items purchased by your customers. For example, if they buy 15 laptops, 20 cameras, and 30 phones, the quantity will be 55. You can get a better idea of which products are in high demand and catch trends.
Avg. price
This metric represents the average revenue per item – a data point to evaluate your product mix and pricing strategy. It's calculated by dividing total revenue by the number of items sold.
Avg. quantity
Quantifying your average quantity sold per transaction lets you know how many products your customers buy on average. This average allows you to adjust your marketing efforts, funding, and product goals to ensure you're making and selling the right amount of products.
To calculate your average quantity sold per transaction, apply this formula:
Average QTY = Product units sold / Number of transactions.
For example, if 50 items were sold in 35 transactions, your Average QTY is 1.43.
Card-to-detail rate
The card-to-detail rate measures the percentage of people who put an item in their shopping cart on a website after viewing that product's page. A high card-to-detail rate may indicate that visitors find the product landing pages compelling enough to purchase the products, which is an insight into the effectiveness of a website's sales funnel.
Buy-to-detail rate
Last but not least is the buy-to-detail metric. This one shows the percentage of people who bought an item immediately after viewing that product's page. Several factors can influence it, including the product page design, photography quality, and product information clarity.
Unlock your business's potential with GA and Bloom
You've seen the potential of Google Analytics and what it can do for your eCommerce business. Once you have Google Analytics tracking your Shopify data, you'll be able to start monitoring key metrics like traffic sources, page views, average order value, and more. This information will help you understand how well your online store is performing and where you should focus your efforts to increase sales and scale.
Are you ready to take your eCommerce to the next level? Apply for a revenue-based loan with Bloom – we can help you get the capital you need to grow your eCommerce operation.
Frequently Asked Questions
What is Google Analytics?
Google Analytics is a free web analytics tool offered by Google that helps you analyse your site activity and then uses this data to generate reports.
You can use it to track eCommerce data, including how much traffic your Shopify store receives, what kind of traffic it receives, where your visitors come from, and what they do on your site. It's a software used by millions of website owners and marketers around the world.
How does Google Analytics work with eCommerce?
Google Analytics works by inserting a small piece of code (also called Google Analytics tracking tag) into each page of your website. When someone visits your site, this eCommerce tracking code sends information back to Google Analytics, which then processes and analyses it. You can then view all of this data in the Google Analytics dashboard.
All these insights go from revenue and transaction data to car abandonment, products sold, and more. Marketing teams and site owners can use Google Analytics to measure the performance of different marketing channels, such as paid search, organic search, email marketing, and social media. This data can help you optimise your marketing spending, drive sales and growth, and increase your eCommerce investment return over time.
Can you use Google Analytics on Shopify?
Absolutely. That's what this guide is all about! Go to your Shopify admin, Online Store, and then Preferences. There's a Google Analytics section there where you can paste your tracking code. You'll also need to have enabled Google Analytics eCommerce settings, though.
Do I need Google Analytics if I have Shopify Analytics?
No, you don't necessarily need Google Analytics if you have Shopify Analytics. However, using both services together gives you a more comprehensive view of your website traffic and shopping behaviour. Shopify Analytics provides information about your store's traffic, including the number of visits, page views, search engine keywords that drove traffic to your store, etc.
But it doesn't provide information about how those visitors behaved on your site - for example, what products they viewed or added to their cart.
Google Analytics eCommerce tracking goes beyond Shopify Analytics by providing insights into how customers interact with your website. For example, it can tell you which pages are most popular, how much time people spend on each page, and how many visitors convert to buyers. This information can help you fine-tune your entire eCommerce.
Does Shopify support Google Analytics 4?
No, Shopify doesn't currently support Google Analytics 4. It's only compatible with Universal Analytics properties, as stated on the Shopify Help Center. As the world's largest eCommerce platform, Shopify is relied upon by businesses of all sizes to power their online sales.
And while the platform is constantly evolving to meet the needs of its users, one thing remains constant: the importance of tracking data accurately.
That's why, despite the impending sunsetting of Universal Analytics on July 1, 2023, it's still the primary way to track eCommerce data on Shopify. We'll update this guide when Shopify releases an update to GA4. In the meantime, If you're looking to use Shopify and Google Analytics together, we recommend using the Universal Analytics property type instead.
It's recommended to start with GA4 earlier, and not waiting for July 1st, 2023. If you want to install GA4 on your Shopify store, we recommend using Easy Tag ‑ GTM & Data Layer” by TAGinstall.
How do I add Google Analytics to Shopify?
To add Google Analytics eCommerce tracking data to your Shopify store, you'll need to follow the instructions in the How to set up Google Analytics section of this Bloom guide.
First, create a new account or sign in to an existing one. Then, click on the Admin and select Tracking Info > Tracking Code. Finally, copy the tracking code and paste it into your Shopify admin > Online Store > Preferences > Google Analytics box.
Once you've added your tracking code, you'll be able to see product data and impression data about your Shopify store's traffic and conversions in your GA account in ~24 hours.
Written by

Sam founded his first startup back in 2010 and has since been building startups in the Content Marketing, SEO, eCommerce and SaaS verticals. Sam is a generalist with deep knowledge of lead generation and scaling acquisition and sales.


