by Sam Franklin | October 02, 2022 | 12 min read
Economic Order Quantity: What does it mean for your small business?
Get fundedLast updated: October 06, 2022
Economic order quantity (EOQ) is a company’s ideal order quantity size. This figure helps minimise overordering, overspending, and storage costs. Practising EOQ means balancing the stock you carry. The ideal inventory should fulfil the demand, thus maximising revenue while not tying excessive working capital in stocks.
In 2021, US retailers of consumer goods products lost over 7% of sales due to stockouts costing them over $82 billion. However, even excess stock costs businesses when products get spoiled, become obsolete or do not sell.
This implies that there must be a balance to avoid stocking too much or too little. The carrying cost should be between 15-30% of the stock value.
This article explores Economic Order Quantity, why you should calculate it, how to calculate it, and how to apply it in inventory management.
Table of contents
You should be calculating EOQ: Here’s why
Inventory is a significant cost affecting small businesses’ working capital (WC) and profitability. Calculating EOQ enables your business to carry equilibrium stock where the quantity of inventory held is neither too much nor too little.
Excessive stock ties down WC, affecting cash flow. On the other hand, limited stock could also cost you customers, especially in eCommerce, where buyers have many purchasing options.
Some key benefits of calculating EOQ:
1. Optimising inventory costs
Calculating Economic Order Quantity enables you to minimise inventory costs by matching ordering and holding costs to the demand. You can also avoid the related storage and order costs, positively impacting the bottom line.
2. Lowers opportunity costs
When you hold excessive inventory, working capital is tied up. You cannot put it in other revenue-generating opportunities. Holding only the necessary inventory frees up money to invest in other activities like marketing, product development, or growth opportunities.
3. Enhances innovation and quick turnaround
In the eCommerce space, consumer tastes and choices change fast. Holding excessive stock can cause your business to incur obsolescence costs if consumers’ choices shift.
Again, customers or market intelligence may point to or demand a product modification. It thus becomes expensive to make any market or customer-driven changes if you hold a lot of stock.
Calculating Economic Order Quantity helps you hold inventory closely matched to demand. Changes in demand or a desirable product modification will therefore cost you less.
What are the three variables you'll need to calculate EOQ?
To calculate EOQ, you need to know the demand for products, the costs of ordering the products, and the costs of holding or storing the goods. This data is typically generated annually.
So, the first task is to calculate the three values.
Order costs
Order cost, also known as setup cost, refers to expenses related to:
Ordering, shipping, and goods handling
Costs of finding a supplier
Expenses related to negotiating the order and production
Costs associated with order preparation and issuing supplier invoices
Processing purchase invoice payments
Inspection fees, staff costs and labour handling inbound inventory
Insurance and freight tax
Unforeseen or impromptu costs affecting an inbound order
Holding costs
Holding costs, also known as carrying costs, start accruing once you receive the inventory at the warehouse or storage facility. Relevant costs include:
Warehouse renting
Expenses for labour handling the inventory
Payment for utilities related to the merchandise
Insurance covering stored goods
Losses due to depreciation, mishandling, or obsolescence
Annual demand
Demand is the number of products you forecast customers to buy in the year. Demand forecasting thus involves both historical and current sales data to determine future demand.
However, you need to refine it to sync with predictable trends, seasonality, and sales growth due to marketing activities, such as adverts and environmental changes.
Demand forecasting is the most inconsistent of the three Economic Order Quantity variables. It is a futuristic value affected by many factors out of your control. For instance, in eCommerce, consumer trends, tastes, and preferences change rapidly. Competition, local and global, is stiff, and new competitors are constantly entering the market. All these factors can render your EOQ useless.
Calculating Economic Order Quantity
Once you calculate the three variables above, apply the EOQ formula to derive the optimal order quantity of inventory. When using the EOQ formula, it’s critical to appreciate the following underlying assumptions.
EOQ assumptions
The Economic Order Quantity inventory planning methodology assumes that annual demand is accurately predictable and constant.
It does not take into consideration inventory remainders. When reordering, the stock is assumed to be zero or fully consumed.
Inventory replenishment is assumed to occur instantly upon reordering. Lead times are not included.
Economies of buying in scale and any supplier discounts are omitted.
EOQ is a maximisation-minimisation problem. The objective is to maximise the number of ordered products while minimising order and holding costs.
Economic Order Quantity Formula
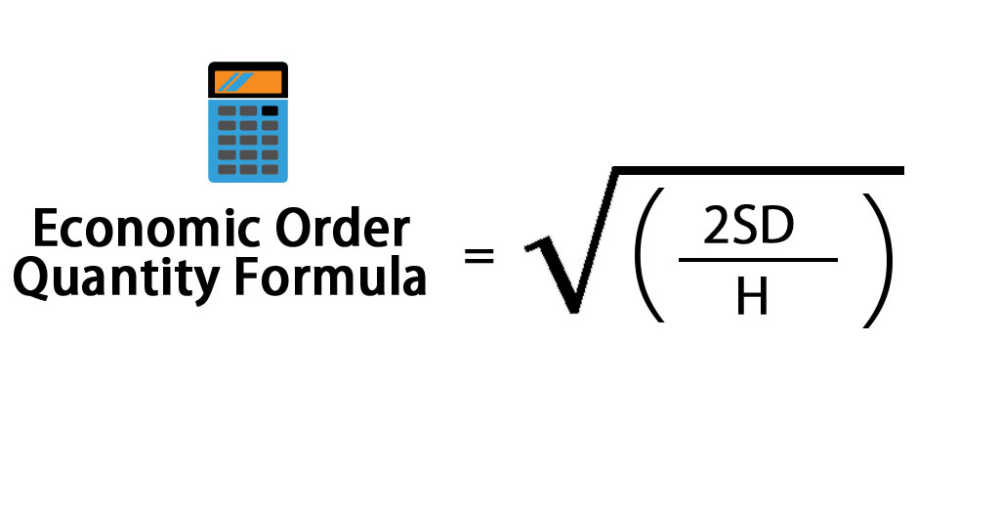
The formula for calculating EOQ is:
Q = √ (2DS / H)
Where:
D is the annualised product demand in units
S is the ordering costs (cost of processing an order irrespective of the number of units in it)
H is the holding costs per unit (cost of holding one inventory item in a year)
Q is the economic order quantity in units
So, to find Q, multiply the demand (D) by the ordering costs (S) first, then multiply the product by two. Second, divide that product by the holding cost (H). Finally, find the square root of the answer you got in step two.
As mentioned before, applying the Economic Order Quantity formula is simple. The bulk of the work is capturing, storing, aggregating, analysing, and isolating data necessary to calculate EOQ variables.
Alternative approaches
If you have derived the three variable costs, you can easily find online EOQ calculators. They are simple to use with inbuilt formulas. You simply input the required variables' info, and they’d produce the Economic Order Quantity in real-time.
On some sites, you can also download an excel worksheet with defined cells and formulas.
An example of Economic Order Quantity (EOQ) in Practice
Manchester Trends is a designer outfit eCommerce store in London. Clegg is in charge of ordering designer dresses for the clothing line. The price of one designer dress is $189. The store sells an average of 52 designer dresses weekly, all weeks of the year. It costs Manchester Trends $120 to replenish one order.
The holding fee per designer dress is $14. Clegg

approaches you to help him calculate the EOQ. Assist him in calculating the optimal order quantity and explain what it means.
To calculate the EOQ for Clegg, we need three things: the annual demand (D), the setup cost (S), and the holding cost (H).
D = $52 dresses a week * 52 weeks in a year = 2,704 designer dresses per year
S = $120 is the cost of one order irrespective of the number of designer dresses ordered
H = $14 is the cost of holding one dress in-store per annum.
We do not use the $189 because it is the selling price per dress. It has no relevance in calculating the EOQ.
Inserting the values in the formula:
EOQ = √ (2DS / H)
EOQ = √ (2*2,704*120) / 14)
EOQ = √ 46354.2857
EOQ = 215.3005
The optimal order Clegg should place at any ordering time is 215 designer dresses. Since Manchester Trends sells 52 dresses a week, Clegg should order the 215 dresses every 4.13 weeks – i.e., (215 dresses per order / 52 dresses sold a week = 4.135 weeks). It takes 4.135 weeks to clear 215 dresses.
Ideally, Clegg should order approximately 215 dresses every 28.94 days (4.135*7 days a week) or about one order a month. He should plan to place about 13 orders in a year (2,704 dresses / 215 dresses per order = 12.577 orders).
Challenges of using Economic Order Quantity
EOQ assumes predictable and constant demand.
It, therefore, works best for eCommerce businesses with stable demand like clothing, consumables and beauty products.
You risk holding surplus stock or running dry before restocking.
This is especially the case for businesses where demand fluctuates. In such cases, it’s advisable to use EOQ alongside other inventory management techniques, such as the period order quantity method.
Calculating EOQ when dealing with many Stock Keeping Units (SKUs) is challenging.
It’s cumbersome to manually calculate EOQ if your eCommerce business sells many products and carries numerous SKUs.
Economic Order Quantity is difficult to calculate for startups with no historical sales performance and inventory cost data. They have no information to base their calculations on.
You might need additional software to calculate EOQ accurately.
Collecting, storing, sorting, integrating relevant information, and dealing with the mathematical complexities require software and/or technology investment. This greatly increases your fixed costs.
It fluctuates with changes in order costs.
If the order cost is high, the EOQ quantity increases. Conversely, when the holding cost is high, the EOQ quantity reduces. After observing such outcomes, you must analyse each variable’s underlying data to isolate suspicious or unusual demand or cost drivers.
Factors that affect EOQ
EOQ is an easy approach to inventory planning but could still be affected by multiple factors, such as:
Stock remainders and reorder levels – When the remaining inventory is too high or too low, you’d need to analyse why and adjust the EOQ accordingly. This is because the amount to be ordered would differ from any previous quantity.
Minimum order quantities (MOQ) – where suppliers demand MOQs to meet economical production goals, the EOQ is adjusted upwards or downwards. Either direction affects your inventory costs.
Lead times – sometimes, lead times are long, and an EOQ order gets exhausted before replenishment. You may require additional inventory above the EOQ level as a buffer.
Unexpected surges or drops in demand – unexpected upward changes in demand exhaust stocks faster than planned. The EOQ level needs to be adjusted accordingly to accommodate such sales irregularities.
Discounts – Accepting discounts from suppliers may lead to the supply of extra items. That ultimately reduces the EOQ at the given time because you may not always need the extra inventory.
How can I use EOQ to improve inventory management?
There are some straightforward applications of Economic Order Quantity in inventory management:
1. To estimate reordering levels
Once you have established the EOQ, use additional knowledge or experience to improve your inventory management. You can decide on reordering levels by integrating the lead times, average periodic usage, and safety stock.
Using the earlier Manchester Trends example, assume the lead time is 45 days. The Economic Order Quantity we calculated for Clegg indicated that an EOQ order is enough for about 29 days. If Manchester Trends does not factor in the 45 days order delivery time, there will be stock out after the twenty-ninth day.
To mitigate that, Clegg should factor in the extra 15 days after the 29th day when the stock runs dry. To do this, he can calculate the reorder level by using the approach below:
Reorder level = Lead time in days * average daily sales + cushion/buffer stock.
Assume the cushion stock is one week’s sales, which is 52 dresses. Clegg’s reorder level is:
45 days lead time * 7.4286 dresses/day + 52 dresses (buffer stock) = 386.287 dresses.
With 386 dresses, Clegg can make his EOQ order every 29th day and have sufficient stock to cover the 30-45th day. If there is an unexpected delay, he has 52 dresses to take him through an extra week.
2. Helps you to accommodate discounts and MOQs
Armed with EOQ, you can easily factor in additional information about supplier discounts or MOQs. Discounts could mean an influx of inventory that can increase your storage costs, for instance. So calculating EOQ would help you determine when to stock more or less to maximise your profits and avoid losses on inventory.
EOQ take home points
Economic Order Quantity is a basic formula for eCommerce businesses to calculate ideal inventory ordering levels. Successful EOQ practices enable small businesses to minimise ordering and holding costs while optimising demand fulfilment.
So, technically, EOQ minimises costs and boosts profits. Although it is relatively straightforward to get accurate EOQ data, factors such as lead times, MOQ, and discounts could impact the quantity of inventory ordered and should thus be considered.
However, hope is not lost. To prevent this from happening, simply adopt software and technology in your EOQ practices. So, if you are not already using EOQ to manage inventory for your small business, it's time you start!
Frequently asked questions
What is the Economic Order Quantity (EOQ) formula?
The EOQ formula is Q = √ (2DS / H), where D is the annual demand, S is the order costs, and H is the holding cost.
What is the main purpose of Economic Order Quantity?
The key purpose of EOQ is to enhance inventory management. Using EOQ helps businesses to calculate an optimal order quantity. The ideal order minimises ordering and holding costs but enables optimal servicing of customer demand.
What data is needed to calculate EOQ?
You need to store and analyse demand, ordering, and holding costs data. The three variables are entered into the EOQ formula to calculate the EOQ.
How is EOQ affected by lead times?
Economic Order Quantity assumes zero lead time upon ordering. You can adjust the EOQ reorder levels to accommodate lead time. Do so by multiplying lead time in days with average daily sales, then add cushion/buffer stock if required.
Written by

Sam founded his first startup back in 2010 and has since been building startups in the Content Marketing, SEO, eCommerce and SaaS verticals. Sam is a generalist with deep knowledge of lead generation and scaling acquisition and sales.


